


.webp)
Everyone loves an underdog story, like the classic David and Goliath, or in this case, GameStop and Melvin Capital. Even if you’re not involved in investing, chances are that you heard about the GameStop story, which started on a Reddit community called Wallstreetbets, went viral and spread like a wildfire.
The story started with Gamestop ($GME) but then many other listed companies became part of the same saga i.e. hedge funds shorted them and groups of retail investors are egging each other on via social media to buy and hold them for as long as it takes to materially hurt the funds involved.
As expected, we were curious about the whole thing, so we decided to have a look on social media and other online sites for learnings that were not obvious and subsequently not in the news. We even dared taking a peek at the Dark Web.
listening247 used its proprietary social intelligence platform to gather 2.5 million posts from December 1st 2020 to January 30th 2021 from Twitter, forums, blogs, news, videos, and reviews, using the following Boolean logic query:
"gamestop" OR "robinhood" OR "melvin capital" OR (("GME" OR "AMC" OR "BB" OR "NOK" OR "EXPR" OR "PLTR”) AND ("stock" OR "stocks" OR "shares" OR "share price" OR "NYSE" OR "nasdaq" OR "wallstreet" OR "trade" OR "trading" OR "short"))
We also gathered the entire Wallstreetbets subReddit from January 23rd to January 30th 2021.

Once the data was gathered, we used machine learning models to annotate the relevant posts with sentiment and topics in a quick and efficient way, adding intelligence to the big dataset in a matter of minutes.
Up until 10-15 years ago, the only way we could have known what the content of the 2.5 million posts was about was to read each and every one of them. Thankfully, nowadays we have the means to understand big data in an easier way, and so after annotating the data with sentiment and topics, the entire dataset was visualised on a drill-down dashboard.
After a few hours of navigating the data and exploring the online conversations, here are 7 interesting things that came up:
The acronym for “you only live once” appeared nearly 55,000 times - mostly as a verb - by small investors communicating that they were betting all they had on GameStop and some other stocks, in some cases asking for advice or encouraging others to follow suit, and oddly enough, in some cases defying the end goal that’s usually behind an investment decision (i.e. to make a profit).
“At the moment, if I had a spare $50k cash to yolo on something, I'd throw it in GME shares or PLTR shares. PLTR for the long term, GME for the short term. Maybe split $20k GME / $30k PLTR, and once GME hits $150 or higher take my gains and dump them into more PLTR.” - Forums
“I just cleared my debts, i have $500, I want to go YOLO, do i buy GME at the price that its at?” - Reddit
“I bought GME at the top. Don't care about making a profit, fuck it. YOLO.” - Forums
“BRB gonna yolo everything into GME! It can only go up!” - Twitter
Even though we only included keywords or brand names for a handful of companies other than GameStop ($GME), even more companies such as Bed Bath & Beyond ($BBBY), American Airlines ($AAL), AgEagle Aerial Systems ($UAVS), and Pershing Square Tontine Holdings ($PSTH) came up in the data. As it turns out, these are some other stocks that the retail investors are strongly recommending to buy and hold for the same reason as $GME.

Net Sentiment ScoreTM (NSSTM)is a great way to rank brands or companies in order to measure brand health and possibly predict how their stock price will fluctuate. It is no surprise that in this case Melvin Capital has the lowest NSSTM at -17%

Some people - particularly on Twitter - believe that Elon Musk further pushed the $GME story with a tweet, which was perceived as him striking back at Melvin Capital because at some point in the past they had shorted Tesla, and apparently he hates them for that.
“Actually, Elon Musk got involved because once upon a time, Melvin Capital shorted Tesla stock. End of story.” - Twitter
“Elon Musk is shilling GameStop because Melvin Capital shorted Tesla a long time ago and bragged about it.” - Twitter
“Apparently Melvin Capital has been bearish on Tesla for a long time. Elon doesn’t forget. haha” - Forums
“He will be up another 5 Million tomorrow. He should thank Elon for his tweet by ordering 50 Teslas” - Reddit
Over 100,000 posts mention the once popular phone brand, as one of the stocks to keep an eye on and buy or hold so as to replicate the $GME effect. Their stock price peaked on January 27th at 6.55 USD.
“🚀🚀NOKIA (NOK) STOCK | MASSIVE POTENTIAL | ARE YOU BUYING?” - Videos
“Bit late for massive gains on $GME. People are saying NAKD, AMC, NOK, and BB are next” - Twitter
“bought massive amount of NOK, i just hope everyone else is holding it as well. :D” - Reddit
“I was late to GME, I’m waiting on today’s market start dip. I’m in on NOK rn.” - Twitter
Very high correlation between online buzz and stock price is observed for companies such as GameStop ($GME), AMC Entertainment ($AMC), and Express Inc. Causation is obvious in this case: online posts by people recommending buying these stocks lead to people actually buying the stocks and thus driving their value sky high.

Albeit just a small percentage of the entire dataset, it’s interesting that just like YOLO, the acronym for “fear of missing out” comes up in online conversations close to 2,000 times. It seems some of those behind the $GME story belong to the generation where fear of missing out is a significant motivation to buy.
“Am I the only one with FOMO buying GME today? I bought one share yesterday and am getting five when the market opens today...not the biggest loss if it goes badly I guess.” - Forums
“I will feel sad if anyone go broke because they FOMO GME.” - Reddit
“I believe there is definitely a strong element of FOMO with this stock, especially with what we’ve seen in stocks like GME and AMC.” - Forums
“@breakneck_tv I think I hopped into AMC a bit late, but fomo after staring at GameStop the last couple days made it so I couldn’t sit out anymore” - Twitter
That’s it for now in terms of interesting - and in some cases useful - titbits, but in ~2.5 million posts there is bound to be more... Stay tuned!

.webp)
.webp)
I’m afraid I am pretentious, but do I have a choice?
It’s always good to provide a credible definition of the subject from the get-go; this is the Oxford dictionary definition of the word pretentious:
“Attempting to impress by affecting greater importance or merit than is actually possessed.”
The root of the word is the verb ‘pretend’, and in this context a pretentious person is someone who pretends to be someone or something she/he is not - which sounds even worse than the Oxford definition.
Social media has probably exacerbated this quality in many people because it makes it easy to pretend hiding behind a screen.
I am the founder of listening247, which as you know is a scale-up that developed an AI based data analytics platform for the integration of unstructured customer data from social intelligence and solicited customer opinion from private online communities. In full disclosure, some of my friends on the advisory board of DigitalMR accuse me of being too much of an engineer - which I objectively am (by education) - and not enough of a marketer.
I always thought of myself as a man of substance when it comes to business, not one to add fluff to a statement to make it sound better than it really is. Who knows how others perceive me...
More and more I am getting the feeling that this is not a quality appreciated in an entrepreneur.
The founder of a Venture Capital firm told me recently that my 5 year revenue forecast is not aggressive enough, and in the same sentence he said: “I like to halve the sales and double the cost of an entrepreneur’s forecast”.
I found this somewhat confusing. Should I boost my revenue forecast beyond what I believe is safe to meet - and yes ideally exceed? Is it a sign of weakness and risk aversion to offer conservative forecasts in order to increase the probability of meeting or exceeding them?
Some introspection might help to flesh this out about myself, and hopefully in the process you as readers will find some value for yourselves as well.
When I was growing up in Platres - a village on the mountains in Cyprus, I had grand aspirations of becoming an astronaut, spearheading humanity to discovering new worlds. As a teenager I was also very conscious of branded clothing and shoes. Aspirational brands were Lacoste, Fred Perry, Levi’s, Adidas etc. So when I got my hands on a t-shirt or polo shirt of the “right” brand, I am positive I came across as very pretentious wearing it at school. Especially so, because my high school catered for around 20 villages of the region, full of kids from peasant families.
I was also very conscious about the make of the car that my family owned. I pegged our Lancia Beta and VW Golf somewhere in the middle of the ranking order. I was not very happy that we did not own a BMW or a Mercedes but could still live with not being at the bottom of the food chain.
In my final year as a student in Germany, I managed to buy myself a damaged 1979 Porsche 924 for 5,000 Deutsche Marks (approx. 3,500 US$) and drove it all the way to Cyprus, where I had the body fixed and painted red. How much more pretentious can a young man be than driving a red - so called “housewife’s Porsche” - in ‘91 in Cyprus?

Vanity is a vice similar to pretentiousness. I guess I was guilty of that too. This is a contradiction to what I mentioned above, about who I think I am today when it comes to business relations. I guess I’m still working through who I really am :).
Nobody likes pretentious people, even if they seemingly “like” their pretentiousness on Facebook or Instagram just to brown-nose them (also known as ass-kissing).
So then why do we do it? Why do we engage in creating a better image of ourselves than is really the case?.
Disclaimer: I am no expert in sociology or psychology, this is just an attempt to interpret my own experiences - so similar to the 4 Pillars of a happy life, another theoretical experiment with one subject (myself).
When I have been vain and pretentious I think the motivation was to be liked, to get respect, maybe even admiration by some. In my case there was never a sinister agenda to make a product sound better than it is so that it can be sold or inflate a company’s forecasted sales so that it can get institutional funding.
What I have failed to see so far is: this approach delivers the exact opposite result with some people.
Maybe most people. Possibly all people.
The jury is still out about the business context and the acceptable marketing kind of embellishment - a grey area whereby the truth is bent to appear better, without lying per se.
Whether people see through the attempt to be liked and are turned-off by a person who appears to be needy or they resent it or they buy the boasting, they see it as such, and they are jealous.
In some cultures and even religions they believe in the “evil eye”! It is often explained as a negative energy emitted by a jealous person towards the one boasting - totally inconsequential whether the subject of boasting is factual or not. A girlfriend says to you: “I love your dress”. Next thing you know you spill tomato soup on it and not only the dress is ruined but you also burn yourself in the process. Whether you believe in a spiritual or scientific explanation of the “evil eye” or you consider it bogus one thing is for sure: if your words, appearance or actions elicit jealousy in people….this cannot be good for you.
Does he think he is better than me?
How come she can afford this handbag? Is it fake?
I wish I had a car like his.
She must be earning twice as much as I do….and she is so dumb.
Why can I not have a baby and she has two and complaints about it
Everyone thinks he is so handsome, what a great person he is….they should look closer
There are people who think this way about you; so what do you think they say to other people on the subject when they get the opportunity? Nice things? Probably not.
Can the things they say harm your career, family life, friendships? You bet!
My conclusion is that I should stop being on stage and just be who I really am, all the time; if anything, go the other way, never advertise facts about me that I am proud of. I always knew that nobody likes a boaster, a pretentious person, a navel gazer but never thought of myself as one - apparently I was wrong. Everyone admires a humble and modest person…
...unless they think it is the cunning attempt of a pretentious person to be liked and gain respect!
In any case, I'll end this introspection here. It's good to do this from time to time, but business calls, and I need to go back to thinking about social intelligence, digital brand equity, social brand performance, online communities, CX measurement, and many other areas we work in.
Stay healthy everyone!

.webp)
I posit that the four pillars of a happy life are encapsulated in these 4 verbs:
Let's call them the Big 4!
Before you go on reading I should clarify that I am not an expert in any of these four categories, I am just very interested in them thus I read and experiment a lot with a single research subject: myself.
Since my day job is running listening247, you may wonder what this subject has to do with data analytics and market research. In case you don't know much about what it is that we do: we developed an A.I. based data analytics & market research platform that helps our blue chip clients make data driven decisions. This capability delivers high fidelity unstructured data by integrating social intelligence with surveys and customer purchases or other transactional data.
On our blog, we have a category called ‘human connections’ and this is where this post belongs. The point of this category is to communicate that a consumer or a respondent is first and foremost a human being. In order for us as researchers to understand why consumers buy a brand, we need to have a deeper understanding of how their brain works and all the motivations that make a human tick.
Just over a year ago I published an article on whether market research adds value to the quality of human life. That article was about what humans need in order to stay alive and functional, with needs like love, sex, fulfillment, spirituality and entertainment falling under a super category called the pursuit of happiness. At the time I wasn’t sure what to do with health, and of course needs like air, water and food topped the list of 11 categories, with health coming in 5th place.
Twelve months, a couple of books and many articles later, I am seeing things from a different lense; a more holistic, more crisp view about the human condition. Let's discuss the big 4 individually and hope we get to some conclusions by the end of this article.
We are what we eat… quite literally, if by we, we mean our body. Many of you who frequent Medium may have seen the documentary Game Changers on Netflix, which strongly recommends a plant-based diet for humans. Many called it one-sided, which objectively it is - but this does not mean the message is wrong. Some called it vegan propaganda. The very fact that the producers chose a much less controversial description instead of Veganism - which sounds like a cult - and went with “plant based diet” was also considered a calculated PR move.
Now add intermittent fasting to a plant based diet and you have a super formula for a super healthy body including brain function improvements; at least this is what the result feels like the result with the one subject of my research (me). It has to be said that intermittent fasting is not for everyone, for example it is not suitable for people with eating disorders. On the positive side according to Dr. Mark Mattson, a professor of Neurology at John Hopkins University, fasting has been shown to increase rates of neurogenesis in the brain (Article of Dr Brady Salcido on Medium).
Our gut microbiome is credited with a lot of power over our wellbeing. The nervous system in our gut is constantly in communication with our brain letting it know the state of our body in real time. Our immune system has a strong dependence on the good bacteria in our gut. “Using your gut feeling” is not just a figure of speech, there is more to our gut than we think.
Here is a fun fact: Most Koreans eat kimchi (fermented cabbage) every day… can anyone guess why?
In order to recover and rejuvenate, a human needs a minimum of 7 hours of quality sleep every night. Most of it should be light sleep but we need at least 4-5 sleep cycles between Light Sleep, Deep Sleep and Rapid Eye Movement (REM). This is the time when muscles recover after exercise and the brain gets rid of harmful toxins that build up during awake time.
Without enough of it we get sick and it is actually possible to die due to lack of sleep.
In a pyramid of health often circulated in fitness circles, you will notice that neither exercise nor nutrition are at the base of the pyramid; sleep is!
In their book Younger Next Year Chris Crowley and Henry Lodge M.D. recommend going to the gym 6 days a week in order to turn back your biological clock.
Apparently after the age of 30, we lose 3-5% of our muscle mass every decade.
Adding muscle mass not only makes you stronger but it also improves your metabolism and passes on a message to the brain that not only are you not heading to your grave, but you are actually going in the opposite direction; getting younger like Crowley & Lodge posit in their book.
Now if we think about Alphabet’s Calico and the Human longevity projects which aim to extend human life (some say to reach 750 years which effectively means eternal), we have an extra incentive to exercise and be healthy so that we can reach “longevity escape velocity”. This is a concept of the life extension movement which implies that life expectancy is extended at a rate faster than the time passing e.g. for every year that passes we find ways to extend life for a year and 1 day or 1.5 years or longer. This has not happened yet.
It may be as simple as endorphin induced euphoria after a gym session, if only it wasn't short lived; the same feeling of euphoria can be replicated with the use of opioids by the way.
Scientists Daniel Goleman and Richard Davidson in their book “The Science of Meditation” lay out evidence that meditation can induce lasting positive traits in the human brain; from better attention and vigilance, to an improved immune system and reduced brain atrophy after the age of 50. There are still not enough MRI scans of the brains of Yogis from the Himalayas to provide solid proof for all the assumed benefits of meditation, but those brain scans that are available strongly hint that the benefits are real.
Permanently altered traits - including longer time functioning in gamma frequency which apparently has multiple health benefits - are accentuated once you achieve over 1,000 hours of lifetime meditation. Like in every other skill such as playing tennis, the violin or football you become world class (possibly a yogi) with over 10,000 lifetime meditation hours!
When you read what comes next you may be reminded of Jekyll & Hyde. So here goes my alter ego:
How could anyone think that happiness is as simple as 4 pillars which dictate black on white actions that can lead to plausible results?
Happiness is so elusive that even the founding fathers of the USA wrote about the “pursuit of happiness” in their constitution. They made it sound like it is a continuous chase of a mythical state that no one has ever achieved - similar to Buddha’s enlightenment.
One thing is for sure though, having no needs and expectations helps. The complete fulfilment of our needs ended when we exited our mothers’ womb. The perfect supermarket… whatever we needed was delivered to us at the blink of an eye. Everything went downhill on exit; we all tried our very best to tell the people in the room at the time, but no amount of crying made any difference.
It is simple really: if we want something and we can’t have it we are unhappy; when we get it we are happy for 2 seconds and then on to the next thing that we want but cannot have.
Some Indian yogis/sages talk about high thinking and simple living.
The 4 verbs, if that’s all we did in our lives would describe a simple life with low expectations and a higher probability of not being unhappy for a longer period of time. When the big 4 are applied to a complex life with high aspirations, sadly they are not sufficient for a happy life; they can lead to a less frantic life which is a step in the right direction, but what about the other 9 million steps to happiness?
The big 4 contribute toward a healthy life which is a precondition for happiness; but they are not enough. If you are sick, whatever else you have will hardly move the happiness needle - unless of course you are a stoic.
I think I am losing my own argument. It is obvious I need some help from professional philosophers...
I’m ending this article with the Stoic take on happiness which is very easy to understand and agree with, but extremely difficult to implement; in a nutshell:
“focus on what you can control accept what you can't”
“No person has the power to have everything they want, but it is in their power not to want what they don’t have, and to cheerfully put to good use what they do have.” – Seneca
“Curb your desire—don’t set your heart on so many things and you will get what you need.” – Epictetus
Maybe brands can play a role in giving humans what they need to be happy; especially if they fulfill one of the basic needs discussed here and if they elicit one of the 14 human emotions that the listening247 proprietary emotions detection model includes.
I think the conclusion is: the stoics get it and maybe a few friends from the Young Presidents Organization (YPO) as well the market researchers and data scientists at listening247.
What do you think?

.webp)
It is not the first time we’ve pondered the issue of whether market research needs a new name. In fact, as far back as 2016, we issued a blog post aptly named “Does the market research industry need a new name?”
This article is about a relatively simple idea but with a slightly convoluted explanation not so much about the name of our industry, more about what it really is becoming. Hopefully the conclusion will have enough clarity to make sense to most readers!
The tagline of the listening247. (est.2010) logo is Market Research Evolved. Not only living organisms like humans, animals and plants get to evolve, but so do ideas, industry verticals and disciplines; especially technology, which is practically a synonym of evolution in certain cases. The other interesting thing about technology is that not only it is a vertical itself, but as a business enabler it cuts across almost all other verticals . Hold this thought, it will all make sense a bit further down in this narrative.
So, 10 years ago we wanted to drive the evolution of market research. Hold this thought too.
Have you ever come across this pair of rhyming words in presentations:
“Evolution - Revolution”?
The presenters who use the pair (including Harvard Business School Profs.) usually want to differentiate between gradual - maybe linear - change/improvement, compared to radical/exponential change.
What about the sentence that has almost become a cliche in tech innovation circles:
“The pace of change will never be this slow again?”
Cliche or not, listening247 needs to change its tagline as a result; and it probably needs to change its name as well - there is no point calling something digital when almost nothing is analogue anymore. There is also no point calling something MR (for market research) when most of it is analytics. We will probably end up calling ourselves DMR and the acronym will have no current meaning, it will merely explain our legacy.
Could the logo tagline change from Market Research Evolved to …Market Research Revolted (from revolution not from disgust :))? That actually doesn’t make much sense even though it is symmetrical with the previous one; maybe Market Research Revolution; though a more appropriate name for this revolution is indeed … drum roll…
”Data Analytics” - powered by AI of course!
During the last 10 years, the pace of change was such that ESOMAR (the biggest global association of market research) is now including the revenues of companies like SAS, Adobe, SAP, and Salesforce in its newly defined market research market.
In the context of social intelligence, listening247 has always supported the notion that harvesting online posts is a commodity. Anybody with some basic programming skills and access to the cloud can harvest posts from Twitter or other public sites. The same applies to data collection in traditional market research which is essentially asking other people questions.
If market research = data collection + data processing + data analysis + reporting then it follows that market research - data collection = data analytics …pretty much.
If you put all the above points together, you will agree that market research started going through a revolution. This revolution is mainly driven by the progress in machine learning and cloud computing. The new face and possibly new name of MR is as the equation above shows Data Analytics. This is the beginning of a consolidation tsunami in the data analytics field marked by landmark acquisitions such as SAP acquiring Qualtrics at a 20 times revenue multiple.
listening247 had to go through a process that took 6 years of focused R&D, researching and ultimately developing tech that was good enough to annotate unstructured data accurately, in any language (and images for that matter), in order to analyse it, understand it and extract value from it - usually in the form of actionable insights.
It turns out the technology that was developed during all these years is not only applicable to market research but it can also be used to:
All these are adjacent markets to market research and they are another strong reason to call what we developed and what we now do …you guessed it…. “Data Analytics”.
We have mentioned this statistic in previous articles: 80-90% of documented human knowledge of all times is in the form of unstructured data; this definition includes text and audio in multiple languages, images and video clips/feeds. This only leaves around 10% of documented human knowledge being numbers in tables; what we would call structured data.
Integrating unstructured data with all the traditional data sources some of which businesses probably already own, has to be one of the biggest game changers of this new decade. A couple of years back the CMO of DIAGEO (on a call about a social analytics report that we were presenting) referred to this idea as the “holy grail”. Case in point WeLab a new virtual bank in Hong Kong, that raised hundreds of millions of dollars in funding, bases its entire risk management strategy in analysing mobile unstructured data.
This data integration can only work if we can ensure we are combining and synthesizing High Fidelity Data (HFD).
Data analytics seems to be a mega industry. According to Statista, the global big data and business analytics market was valued at 169 billion U.S. dollars in 2018 and is expected to grow to 274 billion U.S. dollars in 2022. As of November 2018, 45% of professionals in the market research industry reportedly used big data analytics as a research method.
Market researchers have to move on to the next chapter, we need to build on what we brought to the table and combine the three data sources that matter most:
This is not just market research (customer opinion), it is certainly not just business intelligence (BI - historically analysing transactional data), it is what we now will simply call:
I know I’m repeating myself but I can’t say this often enough: in order for the data integration to not turn out to be useless - or even harmful when it comes to making business decisions, the data has to be as accurate as it can be. This is a simple concept, anyone who has experienced it before wants to avoid it, and it is called GIGO (Garbage in Garbage out).
If this quote is true: “The world’s most valuable resource is no longer oil, but data” The Economist Report in 2017 - and I believe it is - then during this next decade the balance of power might change dramatically on our little planet. With our new company name and tagline : listening247 - High Fidelity Data the future can be nothing but bright and promising!

.webp)
This is the story of a start-up that became a scale-up.
It will hopefully offer some helpful thoughts and tips to first-timer or aspiring entrepreneurs.
I always liked the expression "after ten years of hard work we became an overnight success!". Admittedly, it is self-serving if your company has been around for almost 10 years and it only experienced real traction in year nine going on ten.
The truth is we (listening247) have spent a lot of time and money on Research & Development funded by seven grants: six from Innovate UK - we could not be more thankful, and one from the E.U.. It took six years of focussed R&D to create listening247 in today’s manifestation: a Social Intelligence SaaS for market research power-users on its way to becoming a DIY SaaS for end-clients.
Some people called us grant junkies! No matter what anyone says or believes, those grants allowed us to stay away from institutional investors until today - I will come back to this later.
Another related (and probably cliché) phrase I like is "Timing is everything". The discipline I am referring to, kept changing names: first it was web listening then social media monitoring then social media listening then social listening & analytics and now social intelligence; whatever the name, this data source and insights discovery approach took what feels like forever to become mainstream for the market research function in organisations.
It took social intelligence spend eight or nine years to get to 3.4B US$ (Reuters) in 2017; it is predicted to be 9B US$ (listening247) by the end of 2020 and 16B US$ by 2023 (Reuters). Many people have published predictions about the size of this market in the past and they all overestimated it. They do say that humans overestimate the short term, and then (as a result) underestimate the long term. In other words, if we are conditioned that this market grows by a few hundred million US$ per year we will be taken by surprise when the proverbial “hockey stick” appears.
Well, this article is making sure its readers will not be surprised by the exponential growth of the social media listening and analytics market.
After all “a rising tide lifts all boats”!
I find proverbs, sayings, clichés and buzzwords quite curious linguistic phenomena. Where do they come from, who coined them, how many different interpretations do they have? Take the term ‘scale-up’ for example: “a business that is in the process of expanding”.
Yes, but by how much?
Is 20% enough?
Should it be over 100%?
What if the “expansion” is 300% of 1,000 US$ - does that count?
Whatever the definition, one of the big four accounting firms thought listening247 fits the profile of a scale-up and was invited to participate in an institutional fund raising program; our very first institutional round. The funds will allow us to accelerate our growth and the process will help us sharpen our focus and fine tune our business plan.
Staying away from institutional investors for so long has pros and cons.
The pros:
The cons:
The moral of our story is: perseverance will eventually get an entrepreneurial team to where they want to go... but I think the more succinct description of our state of mind all these years was stubbornness; and the belief that “whatever does not kill us makes us stronger”. Stubbornness may sound like a negative attribute to have, but it really is what kept us going.
Another interesting phrase I saw on the Skype account tagline of a teenager was
"Failure is not a motherf&%*!% option".
Quite inspirational, don’t you think?
.webp)
As one would expect, social media intelligence (or just social intelligence) came up as a subject at the “Social Intelligence World” conference in London back in November 2018. More specifically, it came up in the context: how does it differ from social media listening?
This question took me back several years, when we published our first eBook about “web listening”, our label of choice at the time which was a buzzword; its most popular version was “social media monitoring”. Social media intelligence did not come up at all back then, albeit in hindsight it is odd that it didn’t. I am not sure how we missed it then, but now, when someone asks what is the difference between intelligence and listening, the answer seems quite obvious!
Social media listening or social media monitoring is simply about harvesting the online posts and maybe even annotating them with a topic and/or sentiment. If the annotation is accurate then it answers questions like ‘what are people talking about online’ or ‘how do they feel about my brand’? Social intelligence on the other hand, is about understanding the deeper meaning of what people choose to post - although sometimes there isn’t one - and link it to a business question; notice how the term ‘actionable insights’ has not come up yet? Another buzzword that is overused in the market research sector, and another one for which we published numerous blog posts with our own - very concrete - definition of what it really is!
When we say ‘social media’ in this context we don’t just mean social media platforms, but rather any public online source of text and images which might express consumer or editorial opinions and/or facts. A side note: things would be a lot easier if we meant what we say in a literal way. People who coin phrases or titles or headings tend to take a lot of freedoms on the altar of “crispness” or “snappy creativity”!
listening247 - an aspiring state-of-the-art DIY SaaS looks at the world of social intelligence via four lenses:
We would be remiss if we didn’t mention text and image analytics as a standalone discipline when the source is not social media or other online sources. In such a case the only difference is that the source is not the online web but any other source of text and images. Perhaps if the source is not the online web it should just be called Business Intelligence, which is an old and very familiar discipline within organisations.
Back to the 4 modules, they have the power to generate intelligence derived from unstructured data - which make up 80-90% of the human knowledge, produced since the beginning of time. Structured data which are effectively numbers in tables or graphs only account for 10-20% of all our knowledge as a species.
Unstructured data can be harvested from the web and if we want to stay out of jail we will stick to public data (as opposed to private conversations or personal data). They can be harvested through APIs that the sites which contain the data make available for pay or for free, and through scrapers which can crawl a website and find specific consumer or editorial posts. Responses to open ended questions in surveys, transcripts of focus groups or even call centre conversations are also great sources of opinions and facts (i.e. unstructured data).
In order to make sense of big unstructured data, machine learning is a good place to start. Supervised machine learning requires humans to annotate a big enough sample of the available data. The annotated data-set is then used to train a machine learning algorithm to create a model that does a specific job really well; the aim is to get over 80% relevance, precision and recall. Unsupervised machine learning is making great strides but cannot replace the supervised approach currently.
Once we have a trained model and our data-set we need to process the latter and annotate it in its entirety. The data can be filtered and navigated in many ways. Structured data can be produced in the form of tables, making the analysis of the data-set possible. The goal here is of course to enable human analysts to uncover actionable insights - since machines are not there yet.
Data visualisation is typically done on dashboards or PPT presentations. The most appropriate types are drill-down and query dashboards. There are multiple delivery mechanisms and use cases, e.g.
Social media intelligence has multiple use cases for multiple departments as shown in the list below, annotated as multipurpose ‘intelligence’ or specific ‘actions’:
The many departments involved and the many use cases ultimately create a confusion as to who the owner should be within an organisation. Maybe Social Intelligence should simply be part of the Business Intelligence or the Market Research department, offering custom user interfaces to the various action players with only the information they need specifically to take action.
Having a Business Intelligence or Market Research Department is a privilege reserved only for large organisations. For small and medium enterprises (SMEs or SMBs) that do not have a business intelligence department a different approach and possibly nomenclature should be employed; but this is the stuff for another blog post. In the meantime let us know where you stand on all this by emailing us or tweeting to @listening247AI.

.webp)
Humans are inclined to think linearly. We overestimate the short-term and underestimate the long-term when we forecast. Quite often, linear trends are interrupted by “hockey sticks” that no-one could foresee. For example, no one predicted the exponential growth of computers and smartphones but we have been forecasting flying cars for over 30 years.
Credible forecasters in their quest to become better, look at their past predictions and measure their “batting rate”. This is what Greenbook asked me to do with my 2015 predictions about market research.
There is one dynamic about forecasting that needs to be explained. It may sound like an excuse for getting a prediction wrong but really it’s a compliment to the forecaster. When a prediction puts governments, companies or people in a bad place in the future, then the affected parties do their utmost to avoid that future. Case in point: blockchains were predicted to be the end of traditional banks as we know them due to their power of disintermediation; according to a FinTech rep at a conference in London, Bank of America owns 82% of all blockchain related patents in the US. This article does not mention the percentage but it quotes BofA as the leading company with the most patents in the field!!!
Happening: 4
Not Happening (yet): 4
Possibly happening: 2
Two years later - in 2017 - I published a new list of predictions. As you will see below the quality of my forecasting improved a lot.
Getting the hang of it!
Happening: 7
Not Happening (yet): 1
Possibly happening: 2
From 40% to 70% in two years…. not bad if I may say so myself :)!
One last prediction (from Reuters this time) which we endorse: The social analytics market will be US$16 billion by 2023.

.webp)
A few days after I registered listening247 on alternativedata.org (a spur of the moment kind of thing), companies I had never even heard of before started reaching out to explore cooperation. One of them was Bloomberg. Obviously they were an exception - I did happen to know them.
The unknown (to me) companies were mainly conference organisers fishing for alternative data providers, to bring them together with investment funds.. So we bit.
Our first question as you may imagine, was: what is alternative data? They said that there are many categories such as sentiment from social and news, app usage, surveys, satellite imagery, geo-location etc. and their main use is to give investors an edge in predicting stock prices.
Funnily enough, they all used the same example to bring their point home: satellite images of retailer parking lots, that depending on how full they are, can predict the retailer’s sales and share against competitors. I have to admit, even though it’s a bit out there it does make sense..
Traditionally investment funds and other traders use fundamentals to make their investment decisions. Even though alternative data and the ability to analyse it (using machine learning) have been around for over a decade, in the last 12 months - i have the impression - chatter about it is going through the roof.
I am thinking: “looks like we caught this wave quite early”.
One of my favourite business success analogies is “the surfer”; for the act of surfing, 3 things are required: a surfer, a surfboard and a wave. The surfer is the CEO of a company, the surfboard the company itself, and both are waiting for the mother of all waves to lift and accelerate them. Without the wave, even the best CEO with the best functioning company will not make it far.
Needless to say, we jumped in with both feet.
Next order of business was to figure out for ourselves to what extent our “alternative data” correlates with stock prices. It so happened that when all this interest became apparent we were considering to focus on social intelligence for the banking sector; so when a well known business school asked us if we wanted to investigate the correlation of Bank Governance stories in online news and social media to their business performance we knew exactly what needed to be done.
If you are a regular reader of our articles you will already know the scope of the social intelligence project we carried out:
Keywords for harvesting: 11 major brands including: HSBC, Barclays, RBS, Deutsche Bank etc.
Language: English
Geography: Global
Time Period: past 12 months
Data sources: Twitter, blogs, boards / forums, news, reviews, videos
Machine learning annotations: sentiment, topics, brands, and noise (irrelevant posts picked up due to homonyms)
The data scientists and researchers of listening247, after having cleaned the data from “noise” (resulting from homonyms) they annotated each post with topics and sentiment using custom machine learning models. The sentiment, semantic and brand accuracy were all above 80% as often advertised.
They then regressed the daily stock price of the banks against various time series derived from the annotated posts that were harvested.
The results were astounding!
For each of the 4 examples below I will describe the social intelligence metrics that were correlated with daily bank valuation. As with all R&D projects there was a lot of trial and error going on. What was impressive…….hmmm I will not give this away yet
1. For Societe Generale when we correlated ESG (Environmental, Social, Governance) posts only from News - which means editorial as opposed to consumer posts - regardless of sentiment, the correlation factor of monthly total posts and monthly valuation was R2 =0.79. With the exception of the red spike in the graph below, not bad I would say.

2. For the Royal Bank of Scotland (RBS) the correlation factor was even higher when we correlated the posts from News about ESG with positive and neutral sentiment: we got R2=0.87. In this case we used the 30 day rolling average for both variables. Also visually it looks really impressive - in the graph below.

3. Can it get any better? You bet!! Barclays - using almost the same parameters as for the RBS case but from all sources instead of just News, returned a correlation factor of R2=0.92. By the time I see the Barclays result I am thinking “unbelievable”.
Well, not really. Not only is there correlation between the two, but we also know which way causation goes. Traders are indeed influenced by what is circulating in the news and on social media when they trade.

4. Example number 4 is equally impressive even though the correlation factor is lower. For Deutsche Bank, we correlated negative posts about ESG against their stock price using a 30 day rolling average R2=-0.40. It turns out it makes perfect sense, when the red line (number of negative posts) goes up the DB stock price goes down and when the red line goes down the blue line goes up.

Amazing! Our alternative data turns out to be quite useful primarily to discretionary, and private equity and with a few adjustments to quantitative funds. It feels like the sky is the limit. We probably need to create a new business unit to deal exclusively with the 15 social intelligence metrics that we discovered to date.
Please do reach out and share your views or questions on X, mmichael@listening247.com if you find this interesting.

.webp)
Nope, not in this case!
Statements such as ‘XYZ ranks first on social media buzz’ can be quite misleading. In Social Intelligence, looking at the number of posts (i.e. buzz) about a brand or company is equally important as understanding the sentiment and topics expressed in these posts.
In the case of Deutsche Bank, they do indeed rank first among 10 other global banks included as part of the first listening247 banking report that listening247 launched in April this year, however many of these posts are negative and could in fact harm Deutsche Bank in the real world; in terms of valuation and bottom line impact that is.
In social listening & analytics, the starting date and the time period for which data is to be analysed is not restricted to the date one decides to carry out the project, like it would be in traditional market research (e.g. customer surveys), as we have the ability to harvest and analyse posts from the past. In this first report listening247 analysed English posts about 11 banks, found on X, YouTube, News, Forums, Blogs, and Reviews, during the 12 months of May 2018 – April 2019 inclusive.
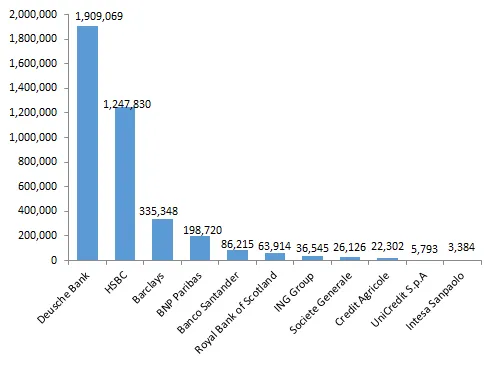
As you can see below, Deutsche Bank with its 1.9 million posts across all sources, commands an impressive 48% share of voice among the banks.

Despite having the largest number of posts, Deutsche Bank is underperforming in ESG, which stands for Environmental, Social, and Governance. Interestingly, news on governance is the driving force behind negative posts about the bank.
In the table below you can see the Net Sentiment ScoreTM (NSSTM) for ESG by bank, where a negative NSSTM is observed in 4 out of 5 quarters for Deutsche Bank. NSSTM is a composite metric in the social intelligence world, that mirrors the well known Net Promoter Score (NPS) from surveys.

Unsurprisingly, the number of posts about ESG with negative sentiment has a high negative correlation with Deutsche Bank’s valuation based on its daily stock price. The negative correlation is even visible to the bare eye in the chart below: when the red line for negative sentiment about ESG goes up, the blue line for the bank’s value goes down.

It never ceases to amaze me how news, in particular negative news, about well known brands and people pick up and in a matter of a few hours become viral. In the case of Deutsche Bank, a jump of 5-10x can be seen literally from one day to the next (April 29/30), the main reason being that the Trump family was suing the bank.

Ideally Deutsche Bank and every other corporation should be able to track buzz around their corporate brand, all their product brands and senior people, so they can react immediately when a PR crisis is about to happen. Containment would be the key intent in cases like this, but the pre-condition is that the bank has access to a social intelligence solution such as listening247*. There are of course numerous other use cases of social intelligence for various bank departments; a couple of obvious ones are:
1. Operational issues can be brought to the attention of senior management in order to be addressed
2. Early warnings can be provided for any underlying problems before they get out of hand
*Using any social media monitoring tool is not good enough, buyers need to be informed on what is needed for accurate analysis and avoiding GIGO (garbage in…), and they need to have proof of the sentiment, brand, and topic annotation accuracy of the tool or solution before subscribing. A minimum of 75% accuracy is achievable in all three cases, in all languages.
Another useful feature for a social intelligence solution is to be able to look at topics (e.g. scandals) of conversations within brands; and not only that but to also be able to drill down into multiple levels of subtopics, as shown in the image below.
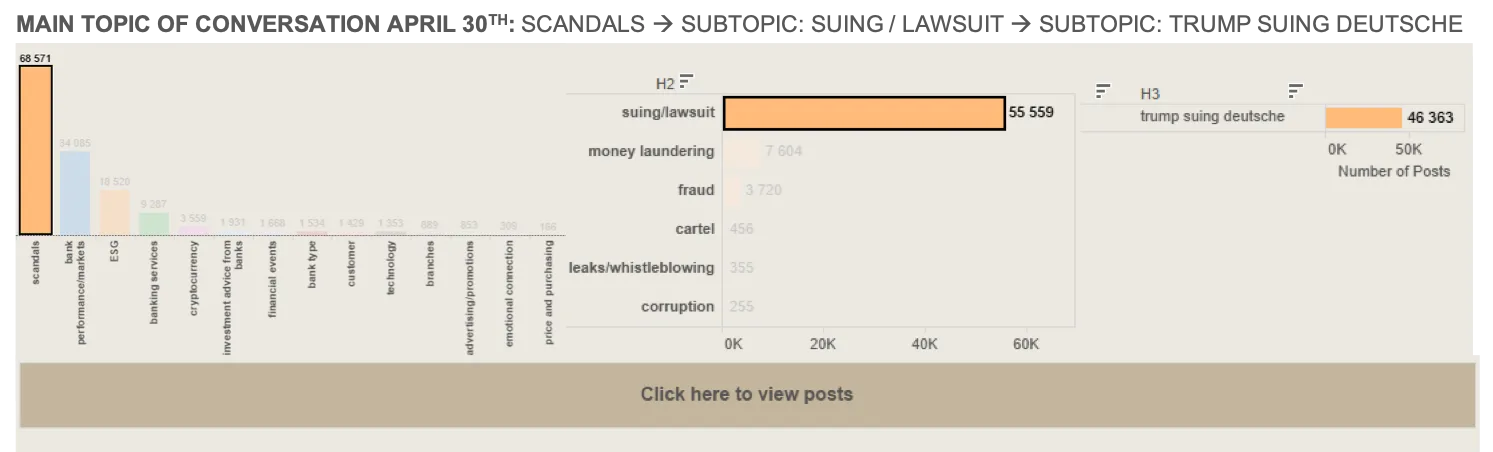
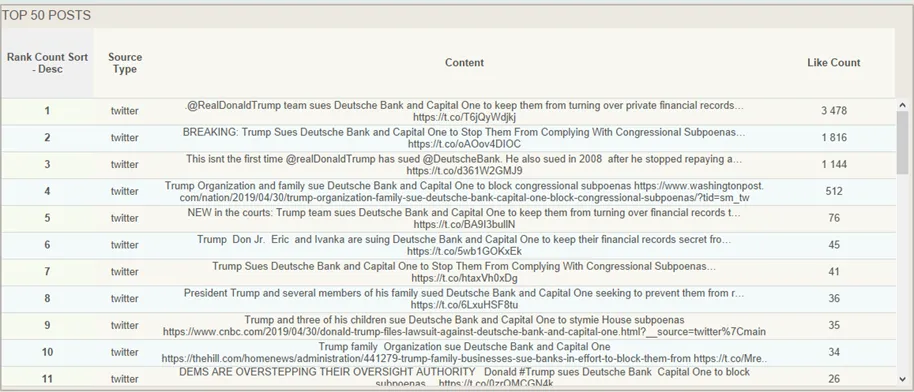
The real magic in a solution like listening247 actually happens when you “click here to view posts” once you have made all your selections on the drill down dashboard; this is where you actually get to see what people really said about ‘Trump suing Deutsche’ (examples in the screenshot below). What makes it even better is that when you click on any one of those posts you are taken to the original post on the platform where it was posted.
Stay tuned for more stories with findings from the social intelligence report for banks brought to you by listening247. In the next story we will analyse how banks can predict their future business performance expressed in their daily stock closing price using accurate social intelligence. In the meantime please do connect with me on X or email me at mmichael@listening247.com to ask questions or offer a view on this article.

.webp)
This is a short story about social intelligence (SI) and banks. The unique selling proposition of listening247, a social intelligence solution, is high multilingual accuracy for sentiment, topics and brands; unfortunately this is also one of the solution’s biggest obstacles to scale. This trade-off between accuracy and scale was consciously made by a team of people - they were market researchers and they do have tremendous respect for data accuracy, sometimes to their detriment - until one day, not too long ago, they realised scalability does not have to be a trade-off.
Normally it took 3 weeks to create new custom machine learning models every time they came across new categories and languages. The operative word is new in the previous sentence. That was their little secret on how to reach higher brand, sentiment and topic accuracy than their competitors. They realised that once they have the A.I. custom set-up (for a product category and language) done then they could be on the same footing as every other social media monitoring tool on scalability, but with a much higher accuracy. That’s when they decided to pick one industry vertical, create the necessary set-up and run with it.
The decision was not easy, there were too many variables; they created a strawman proposal and asked the question to the whole company and its advisors; after a couple of weeks and a lot of back and forth they picked the banking sector. There are many good reasons why this vertical deserves focus. They could have taken an FMCG product category or retail, healthcare, automotive or telecoms but they chose to enlighten the banks first, before they tackled the rest of the world (in their own words). Here are some of the reasons that influenced their decision:
They had to start somewhere so with the help from a high profile advisor from the industry they picked 11 major banks, mostly multinationals to use as keywords for post harvesting. Here is the rest of the scope:
Language: English
Geography: Global
Period: Past 12 months
Sources: Twitter, blogs, forums, news, reviews, videos
Machine Learning Annotations: Sentiment, Topics, Brands, Noise (irrelevant posts which contain homonyms)
Deliverables: annotated data in CSV and Excel, drilldown and query dashboards, powerpoint presentation.
For the ESG impact on bank performance for their R&D project with the University they also retrieved the daily valuations of each of the 11 banks from Yahoo/Google Finance.
They harvested 4.5 million posts for the 11 banks in English globally. The pie chart below shows the share of each source type. Twitter was by far the biggest source of posts followed by News which is the only non-consumer source, mostly editorials published by the banks by journalists or by the banks themselves.

For DB, HSBC, BNP Paribas, Santander and Credit Agricole, Twitter was the biggest source of posts. Consumers do talk a lot about their banks, especially when they have complaints. On the other hand for Barclays, SosGen, Unicredit and Intesa Sanpaolo News was the biggest source which means that their customers do not have complaints or they do not focus on engaging with them on social media.

The findings were presented for the first time to a group of board directors of banks from various countries who were taking part in the International Directors Banking Programme (IDBP) at INSEAD.
Here are some of the highlights of the report:
1, Deutsche Bank is ranked first in terms of Buzz (=total volume of posts) with 1.9 million posts from all sources. This represents 42% share of voice for DB which is followed by HSBC and Barclays, as you can see in the bar chart below.
2. The net sentiment score (NSS) was calculated for each bank and was used to rank them in the chart below. This is a trade marked score of DigitalMR and it combines all the positive, negative and neutral posts. RBS has the lowest score with a -3% whilst HSBC leads the pack with a +9% score. Considering other verticals or product categories the top NSS score of 9% recorded here, is quite low.

3. When it comes to topics of conversations online, financial events scored -8%. ESG scored +5% with the top topic being emotional connection. ESG seems to be a very hot topic around banks and other corporates.

4. The report can be quite granular in terms of topics and time periods. The table below shows a drill down into ESG by brand and quarter for net sentiment score. The colour coding makes it easy to pinpoint the problem areas. Deutsche Bank and RBS are the ones with the most quarters showing a negative NSS.

It looked as if the board level executives had never seen anything similar before, they viewed the results with some scepticism, they asked quite a few questions. Some of them wanted to drill down and understand more especially those of them who were with banks included in the project. The question is will they manage to get the management of their banks to integrate social intelligence in the other streams of data they have?
What makes this report credible is that we know its sentiment and topic accuracy is over 75%. This is not just a number thrown out there, it can be verified by anyone. You can extract a random sample of 100 posts, read through them, and verify with how many brand, sentiment and topic annotations you agree. By the time we publish the next short story on the banking report the machine learning models will improve themselves to accuracies over 80%.
In the next article you can expect to find out how news about governance impact the valuation of the banks. If you are wondering what other ways there are to create value for your bank from a social intelligence report like this, stay tuned; if you can’t wait two weeks reach out to me via X or email, Talk soon!

.webp)
Yes!
I thought I should get the answer to the title question out of the way, not that it wasn’t obvious what the answer would be. I violated one of the cardinal rules of market research in this case and asked a biased question. Having said that, let’s use a methodical approach to prove that this answer is indeed the correct one. Let’s start by first considering what market research is, and what it is not.
Market research is:
Market research is not:
Small and medium sized enterprises (SMEs) do not have market research departments; they often don’t even have one single employee dedicated to market research. Why do you think that is? In my view, it’s probably because they believe that other investments closer to sales are needed more than market research. Of course this doesn’t mean that their marketing department won’t buy the occasional syndicated research report or even commission some custom research every now and then.
According to OECD a small enterprise typically generates up to 10 million euros and a medium enterprise up to 50 million euros of annual turnover. Companies even larger than that don’t have market research departments. If I had to guess I would say a company would have to be over 250 million euros for a market research department to be the rule rather than the exception.
Consequently we have two types of companies to consider:
It is safe to say that all blue-chip multinationals belong to group A. Most of them treat market research with respect, especially the FMCG manufacturers. P&G is probably the biggest market research spender in the world. Their ability to swiftly turn information into action is legendary. I will venture say that this is one of the main reasons they are the biggest FMCG company in the world. They are an insights driven organisation through and through.
The rest of the organisations (that belong to group B.) in most cases have the marketing department deal with carrying out or buying market research when they need it. If they have access to lots of data they may give it to the Business Intelligence department (if it exists that is) which is more about analysing owned data and not collecting new - especially customer opinions. Now within a marketing department, depending on company size, we have a CMO or Marketing Director, and the rest of the positions and functions are all over the map: Brand Managers, PR Managers, Social Media Managers, Digital Marketing Managers, Communications Managers (internal and external).
For all the things that market research is and is not, every person in a marketing department - all things being equal - would prefer to be called something other than a ‘market research manager’. A market research manager is not on the front line heroically battling competition helping the organisation sell more… they are an ancillary service in the absence of which the heroic marketing employees will make decisions based on their experience and gut feeling. Without data, some will get it right a few times and they will make sure it is known by everyone and will be celebrated; in most cases they will get it wrong or not entirely wrong but without great results, and they will find ways to explain it away (i.e. shove it under the rug) and move on. In such occasions market research is actually the enemy because it can show exactly what the marketers did wrong, or even worse for them it can show why they should not have launched that campaign or change that product messaging or package. The market research method they should have used is called pre- and post campaign evaluation. It can be carried out using social intelligence and online survey methodologies.
Last November I was speaking at the first social intelligence conference of its kind - probably in the world. It took place in London and it was about social media listening and how to turn the findings into useful intelligence. A few of the pundits represented the opinion that social intelligence should be its own discipline and not be part of the insights function (the slightly sexier way of saying market research). When I asked why, the answer was: no-one in a marketing department wants to be called a market research manager…..thus “market research” are dirty words for marketers; case closed. I would love an opportunity to discuss with you, the readers of this post, if you have other thoughts on this subject or (even better) if you are in agreement. Please write to me on Twitter @listening247AI or send me an email.

.webp)
There is a relatively simple formula which describes “weak” or “narrow” artificial intelligence: AI = ML+TD+HITL. To be more specific, this is the definition of supervised machine learning, which is the most common method to produce artificial intelligence. The acronyms in the formula stand for:
Strong artificial intelligence - as defined by the Turing test - is when a human has a conversation with a machine and cannot tell it was not a human, based on the way it responds to questions. The optimists believe that strong AI is 10-15 years away whilst the realists/pessimists say not before the end of this century.
Over 90% of all human knowledge accumulated since the beginning of time, is unstructured data. That is text, images, audio, or video. The other 10% are numbers in tables which is what quantitative market researchers usually use. The qualies, they are the ones using unstructured data, but the volume is limited to a few pages or a few video clips that a person can read/watch in a couple of days.
Other than reading, listening to, or viewing unstructured data, 15 years ago there was no other way to discover their content and understand their meaning. Thankfully (especially if we are dealing with big data) today there is a way to discover and understand the information hidden in mega-, giga-, tera- or n-ta-bytes of data; you guessed it, it is AI. Machine learning allows us to create models that can process large files of text or images in seconds, and annotate sentences, paragraphs, sections, objects, or even whole documents with topics, sentiment and specific emotions. Sentiment and semantic analysis are the two most popular ways to analyse and understand unstructured data with the use of machine learning or a rules based approach. When the unstructured data to be analysed is in text format, the discipline falls under Computer Science (not linguistics funnily enough) and is called Natural Language Processing (NLP) or Text Analytics.
Semi-supervised-, unsupervised- and deep-learning are other forms of machine learning, used to a smaller extent in a market research context, even though deep learning implementation is picking up speed - especially for image analytics.
There is a multitude of users, data sources and use cases within an organisation. Let’s take a look at relevant data sources first:
ESOMAR mainly caters to the market researchers in organisations globally, but there are many more users of text and image analytics solutions sitting in different departments, that can benefit from using AI to understand unstructured data. Here is a combined list of users and use case examples for each one, which is not exhaustive by any means:
If we agree that social intelligence is currently the most popular application of AI in research and insights then it does make sense to review possible questions that can be answered using it.
If you are amenable to a bold statement such as “social intelligence may replace some traditional market research methods used to solicit consumer opinions” then here is a list to consider:
Of course whether social intelligence can replace them altogether or enhance them depends on the country, language and product category. If you have not embraced the use of AI yet, to tap into the wealth of unstructured data available to us everywhere, then at least keep an open mind and keep asking questions that will help you make an informed decision when the right time comes.

.webp)
This may not be a 100% original idea. Other people have thought of a version of it in the past, like the Russian news site City Reporter. The site brought positive news stories to the front of its pages and found any and all silver linings in negative stories - “No disruption on the roads despite snow,” for example.
Nevertheless, we posit that launching a news channel that will only report good news will have a positive impact on humanity. It’s all in the execution. The same idea can be executed well or really badly... if in the case of City Reporter it was the latter we should give the idea another chance.
Here is an open invitation to the powers that be in the news industry: the CNNs and the BBCs of this world to consider a global initiative and launch a TV and/or online News Channel that will only report the good news, and ignore the bad ones. We are not suggesting spinning the bad news to make them sound like good ones, just ignore them. In this respect this may be an original idea after all.
The news industry is defined by the saying: If it bleeds it leads.
Here are some excerpts from a Guardian article by Steven Pinker for more context:
In a BBC article by Tom Stafford, an academic experiment is described around how people deal with negative vs positive news. This is an excerpt from the article:
“The researchers present their experiment as solid evidence of a so called "negativity bias", psychologists' term for our collective hunger to hear, and remember bad news.
It isn't just schadenfreude (from the German words : Schaden=damage + Freude=joy, it means: pleasure derived by someone from another person's misfortune - bracket is not part of the excerpt), the theory goes, but that we've evolved to react quickly to potential threats. Bad news could be a signal that we need to change what we're doing to avoid danger.”
No one can say it better than Steven Pinker in his genius article on The Guardian:
“Make a list of all the worst things that are happening anywhere on the planet that week, and you have an impressive-sounding—but ultimately irrational—case that civilization has never faced greater peril.”
The subconscious stores everything even if we don’t know it.
According to 26 experts our subconscious stores every event, occurrence, emotion or circumstance from before we were born (i.e. from the womb... nothing metaphysical). It also fails to distinguish between real and imagined. If we keep contaminating our subconscious with negativity it will inform our future decisions influenced by this content, be it real or the product of a movie. It records everything without judgement but everything in our subconscious is part of who we are.
There are some people who avoid watching the news for this exact reason. What if we could give these people a news channel they can watch?
listening247 lives and breathes agile product development. In the world of agile a prototype is created first, to serve as a proof of concept. If the prospects seem good, then with multiple iterations it gets improved into an Alpha-, then Beta-version, and ultimately it is launched in production mode.
This is exactly what we suggest we do in this case as well. This article is almost like an open strawman proposal to all news media.
How about listening247 starts by doing what it does best: find good news online. We can create a social media daily harvester of posts with positive sentiment, in a few different languages, using our proprietary Generative AI.
We will then implement an automated stage of curation based on topics and report them on a daily newsletter and micro-site in a number of fixed columns as well as top stories and features. Here are some assumptions on the columns and features:
Let’s first see the kind of content we will get from social media listening and whether we think it has potential as a Digital TV channel. Should that be the case then maybe we can go to a VC fund or a like-minded charity foundation with this business idea and give it a go. Please contact us on X or email me with your thoughts.

.webp)
listening247 answer:
listening247 is a technology company in the market research sector offering platform access as well as end-to-end market research services to Agencies, FMCG, Retail, Financial Services, Telecoms, Tourism & Hospitality, Healthcare, Automotive, Government & NGOs.
listening247 answer:
listening247 answer:
The pricing for social intelligence is based on product category, language (not country) and period covered. A rule of thumb is that an average product category is defined by up to 12 competitive brands. These 12 brands are used as keywords for harvesting from the web. The frequency of reporting and the delivery mechanism also have an impact on cost.
The pricing for any text or image analytics processing and annotation through an API, regardless of data source, is charged per annotated post or image.
listening247 answer:
Yes, for many different product categories and languages and in different formats e.g. PDF decks, infographics, one pagers and demo dashboards.
listening247 answer:
For Social Intelligence listening247 harvests data from social media and any public website such as Twitter, Blogs, Forums, Reviews, Videos, News and also Facebook and Instagram with some limitations that apply to all data providers.
The listening247 text and image analytics technology is source agnostic and can therefore ingest client data from open ended questions in surveys, transcripts of qualitative research, call centre conversations or any other source of unstructured data.
listening247 answer:
For social intelligence listening247 uses all the available methods to harvest data from public sources i.e. direct APIs, Aggregator APIs, Custom crawlers and scrapers, RSS feeds etc. When doing so listening247 abides by the ESOMAR code of conduct, the law and the Terms & Conditions of the sources.
For client data - see answer to Q6 - the client can share its own data by email, on FTP, on cloud drives or through APIs.
listening247 answer:
For social intelligence yes - as long as the posts still exist online at the time of harvest.
listening247 answer:
Text, images, audio and video can be harvested from the web or taken from other sources (see answer to Q5). listening247 - the listening247 software - does offer the capability of data harvesting from online sources. It provides buzz (word counts), sentiment, 7 pairs of opposite emotions such as ‘Love Vs Hate’, and semantic (topic) analysis. The topic analysis provided is inductive (bottom-up) and top down. Topics can be broken down in sub-topics and sub-topics in attributes and so on. listening247 can also analyse images for objects, brand logos, text (extraction) and image theme (aption). It uses 3rd party technology to turn audio to text, followed by its own text analytics capability to analyse for sentiment, emotions and topics.
listening247 answer:
The listening247 software represents the implementation of years of R&D funded by the UK government and the EU. It includes supervised, semi-supervised and unsupervised machine learning as well as deep learning for data “cleaning”, sentiment, emotions, topics and image annotations. For data “cleaning” and topic annotations listening247 uses a combination of engineered approaches and machine learning. All listening247 custom models and set-ups continuously improve their accuracy. The user can also provide improvements to the supervised machine learning models by adding training data any time.
listening247 answer:
The text analysis is done at document, paragraph, sentence, phrase, or keyword mention
level. This is the choice of the client. The analysis extracts named entities, pattern-defined expressions, topics and themes, aspects (of an entity or topic), or relationships and attributes – and it offers feature resolution, that is, identifying multiple features that are essentially the same thing as the example in the guidance (Winston Churchill, Mr. Churchill, the Prime Minister are a single individual.)
The sentiment or emotions analysis is ascribed to each of the resolved features or at some other level; the user may choose the resolution of e.g. sentiment/emotion and semantic annotation.
listening247 answer:
listening247 provides document level data with the capability to drill through to the posts/verbatims, making it possible for users to verify the accuracy of all the annotations made by the models.
listening247 answer:
In literally all languages, including the likes of Arabish (Arabic expressed in Latin characters) and Greeglish (Greek expressed in Latin characters), since the automated analyses are done using custom models specifically created for the particular product category and language. The only trade-off is that it takes 1-3 weeks to create the set-up that guarantees the accuracy as advertised.
listening247 answer:
listening247 uses its own proprietary software and models to produce all the analyses. It provides fully configured customised models; the end user is not responsible for that training but has the option to participate or improve if they wish to do so.
listening247 answer:
When it comes to social intelligence, limited demographics are available in the meta-data of normally harvested posts - see Q6. Any and all demographics can be inferred/predicted using a custom machine learning model which is trained to classify authors based on the way they write. The accuracy of prediction can be validated by testing it on new annotated data that was not used to train the model.
listening247 answer:
For social intelligence listening247 typically harvests and reports all the posts from all the keywords and sources included. This is called census data as opposed to sample data. Data sampling is only done at the training data generation part of the process when the approach used is supervised machine learning. A random sample of 10% or up to 20,000 posts whichever is smaller is used as training data annotated by humans.
When it comes to sources other than the web, lower samples are needed to train the machine learning algorithms in order to reach the minimum accuracy.
listening247 answer:
listening247 was originally designed for market research purposes (in any language) thus the focus is on data accuracy and data integration with other sources such as surveys and transactional/behavioral data for insights. A few years down the line, it is now also being used for sales lead generation and identification of micro/nano influencers.
listening247 answer:
For social intelligence, listening247 uses a combination of boolean logic and machine learning models to eliminate irrelevant posts due to homonyms. The priority and focus during the set-up period of a social listening tracker is to include all the synonyms (also misspellings, plurals etc) and exclude all the homonyms. Typically the data processed is over 90% relevant i.e. only a maximum of 10% is noise.
listening247 answer:
listening247 offers a money back guarantee for the following precisions in any language:
Recall is usually at similar levels but it is not deemed as important as precision for market research purposes because if we end up with say 50% of all the data (50% recall) the sample is still hundreds if not thousands of times higher than the samples we use to represent populations in surveys.
For image captioning the committed Bleu-1 score is >75%
listening247 answer:
Yes
listening247 answer:
Different users have different definitions of spam. These are identified at the beginning of the project and eliminated during the set-up process described under Q17 by using a combination of boolean logic queries and custom machine learning models. Clients are also enabled to flag and remove spam themselves should they find any.
listening247 answer:
Yes absolutely. Even more than that since listening247 complies with the ESOMAR code of conduct which is stricter than the local laws.
listening247 answer:
listening247 abides by the ESOMAR code of conduct and not only stays informed about changes with the laws and terms & conditions of specific sources it actually gets actively involved in making sure the clients/users of these services stay well informed (e.g. the initiative to create this document under the auspices of ESOMAR). listening247 uses the highest standards of security in storing and transmitting data.
listening247 answer:
The codes of conduct and industry standards including the ICC/ESOMAR International Code on Market, Opinion and Social Research and Data Analytics; the Market Research Society in the UK (MRS).
listening247 answer:
By abiding to the codes of conduct mentioned in Q23. In the occasions when an author of a post is contacted by listening247 the etiquette of the medium where the post was found is strictly followed and the medium/platform allows such contact and is usually expected by the authors of such posts. No offers are made unless the author indicates acceptance in the process of following the contact etiquette.
listening247 answer:
Only data from public sources are shared with users without masking. If the data is not from a public source then it is only offered in aggregated form or masked.
listening247 answer:
Most of the data in social intelligence is public but in the occasions when the data is owned by the client or is sourced from a non-public source cutting edge security measures are used. listening247 uses secure sites and encrypted transmissions to protect the data in its custody.
All the communication from and to listening247 happens through a Secure Sockets Layer (SSL) to ensure the encryption of communication client-server. In addition our hosting partner has successfully completed multiple SAS70 Type II audits, and now publishes a Service Organization Controls 1 (SOC 1), Type 2 report, published under both the SSAE 16 and the ISAE 3402 professional standards as well as a Service Organization Controls 2 (SOC 2) report. In addition a PCI (Payment Card Industry) DSS (Data Security Standard) Level 1 certificate has also been received. The users are welcome to carry out their own audits.
.webp)
The missing link in CX measurment is...Social Intelligence!
CX stands for customer experience for those of you who are not familiar with the acronym. There are more related acronyms that are sometimes used interchangeably: EFM (Enterprise Feedback Management), CEM or CXM (Customer Experience Management or Measurement). Measurement happens first, management follows. Titbit: managing the experience without measuring it first is like driving a car in complete darkness.
Forbes says that customer experience is the "cumulative impact of multiple touchpoints" over the course of a customer's interaction with an organisation.
A Wikipedia definition for EFM is: “Enterprise feedback management is a system of processes and software that enables organizations to centrally manage deployment of surveys while dispersing authoring and analysis throughout an organization…
…Modern EFM systems can track feedback from a variety of sources including customers, market research, social media, employees, data collection, vendors, partners and audits in a privatized or public manner.”
This article is definitely about modern EFM systems, and the main point here is that it is not enough to use surveys as the operative word in the EFM definition above.
There are many sources for customer experience feedback but they can be classified in three main groups; these are data from:
The 3rd group is what we refer to as Social Intelligence.
The mainstream customer experience measurement vendors focus on surveys after each experience type; the really good ones also measure visits or sales, recording feedback on digital kiosks, using call centers, chat apps and even face to face interactions to record, measure and integrate.
Here is what the excellent ones do: they do a 360 degree measurement by including and integrating social intelligence on top of everything else. Although social Media is mentioned as a source of information by most, it is very rarely included in a customer experience measurement program. When it is actually included, it is limited by their language analytics capability, as the few tools that do this can only carry out text analysis - for sentiment in particular - in English, or translate another language into English and then annotate the data with sentiment. Most importantly, when they offer it their sentiment and topic accuracy is lower than 60%.
EFM is another case of disruption of a very specific part of market research: the stakeholder assessment. Unfortunately, the market research sector has been very slow in adapting to change, with the result being that tech companies have mushroomed in the areas of DIY, Social Media Monitoring, Mobile and EFM/CXM.
An organisation cannot replace their customer loyalty and employee engagement programmes (run by a market research agency), with a flashy software platform from one day to the next. Our suggestion to users is to always ‘connect the dots’ to combine multiple sources of information, i.e. “marry” state of the art technology with experienced analysts and data scientists; only then, can true insights be synthesized. A machine cannot do that on its own - even if the best machine learning algorithms are employed, utilising the best methods of predictive analytics.
Some multinational market research agencies that decided to fight back for what has been theirs are Nielsen, Ipsos, Maritz and Kantar. The tech companies that are leading the push and growth in this sector are the likes of: CloudCherry, Medallia, Qualtrics, Evaluagent, Usabilla, Aptean, Critizr, Verint and so on.
Where should all the feedback from all the different sources “live” so that it can fulfill its destiny? Its destiny being to drive customer commitment and loyalty that is. Typically it should “live” on an online dashboard. Is it straightforward to integrate social intelligence to surveys? Nope. It takes a good thorough understanding of how customer satisfaction/loyalty and experience surveys work alongside the unsolicited online posts. Simple things are misunderstood and lead to confusion if the vendor is not experienced in all data sources. For example, someone who posts online is labelled as a “respondent” and their post is labelled as a “response” - which implies there was a question to begin with, when it is rather about an author and a post expressing an unsolicited opinion or fact.
Data integration happens at multiple levels:
The feedback delivery mechanisms vary and it is best to use a combination of the following:
Everything described in this article boils down to one idea: delight is the sought after customer experience by the customers and the service organisations alike. It is rather simple when you think about it: understanding what the customer wants, needs and likes is a precondition to delight; without social intelligence an important piece and multiple experience touchpoints are missing from the full picture. As always please do reach out with your own feedback on X or by email.
.webp)
.webp)
Article titles are very important, they can make or break an article, so I usually consider multiple before I choose one. Here are the ones that did not make it this time:
On to our topic, there is a phrase I first heard from a friend in Poland - who probably got it from Arthur H. “Red” Motley or Peter Drucker (the famous business author), or even IBM’s Thomas Watson: “nothing happens until someone sells something”. These were all business people and they obviously meant this phrase solely in a business context, but I think the phrase is true in a much broader sense.
Think about it; if you are a kid you sell how much you want that toy to your parents, if you are a teacher you sell the importance of education to your students, if you are a priest you sell your religion to your community, if you are a politician you sell your plan to the voters... you get the idea. “Selling” goes beyond trading products or services for money. So when Drucker says “nothing happens...” it looks like literally nothing happens; these business gurus have elevated themselves to deep philosophers by sharing this universal truth with the world, probably unknowingly.
This article is about generating good sales leads that easily convert to a sale. It is about finding leads deep in the sales funnel, ideally just one small nudge away from buying.
I usually try to provide some structure to make it easier to scan and decide what to read in more detail; In this piece I will describe the lead sources, then talk about the lead generation process, spend some time on conversion and finish off with how purchase intent on social media or on the public web works.
At the highest level there are two types of leads:
People often refer to inbound lead generation as “pull” marketing; in other words the lead finds an offer and proactively reaches out to a sales organisation inquiring about the product or service with the intent to buy. An inbound marketing plan involves great SEO (search engine optimisation), SEM (search engine marketing, otherwise known as paid search), affiliate marketing, brand ambassadors - ranging from nano influencers to celebrities, as well as other types of advertising (online and offline) and digital content sharing. This of course applies to online leads, the 100% offline purchase path is simpler: watch a TV ad, go to a brick and mortar store and buy the product.
Outbound lead generation, also known as “push” marketing, involves reaching out to the prospects with an offer, whether using email campaigns or cold calling; I personally prefer warm calls. Companies usually use their own CRMs to contact existing clients and leads, they may buy lists of possible leads who consented to being contacted, or they may even hire companies that already have access to relevant leads and pay them to contact them with their offering.
The cool way to say lead generation process: Lead Gen. Incidentally, I recently learned from a much younger person that it is not cool to say ‘cool’ anymore. Go figure.
The lead generation and conversion process is simple:
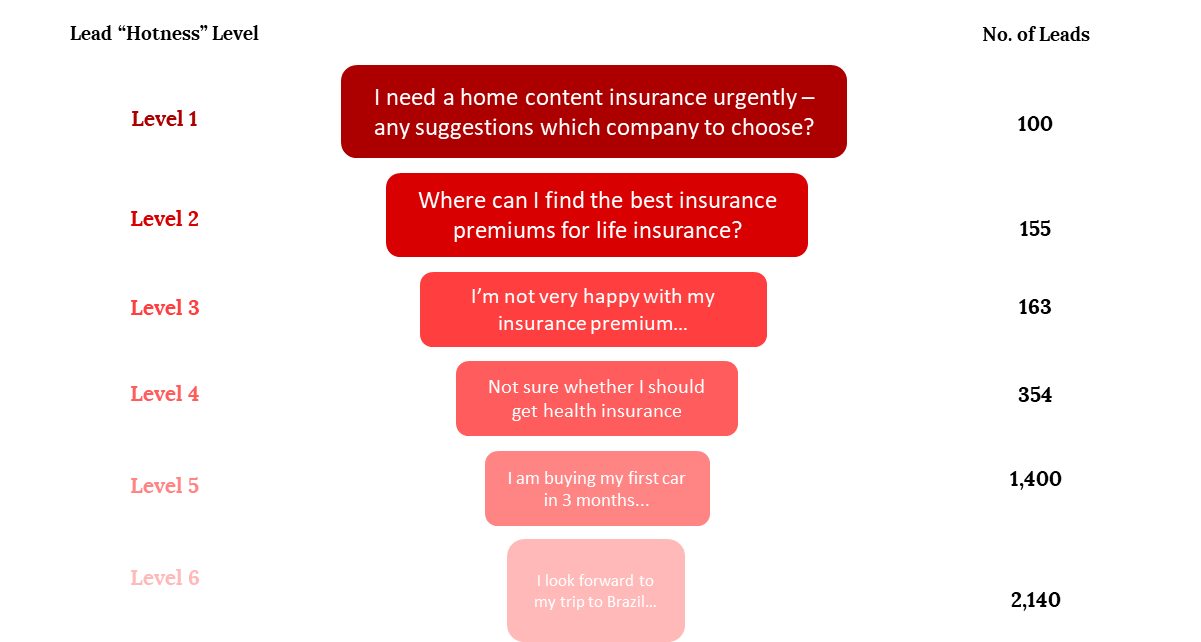
Admittedly finding, qualifying, and contacting a lead is the easy part; the difficult part is to nurture the lead and actually sell something.
I have seen claims that between 7 and 11 touch-points are needed to go from an unaware lead to a converted one to a customer. This is why multi-channel marketing makes a lot of sense.
Imagine a B2B lead receiving a cold email with an offer from an unknown company; they don’t open the email but the subject line and the company name sort of registers in their mind. Then on the same day a sponsored post appears in their Facebook newsfeed - now they are trying to remember why this company name is familiar; when the same post appears in their LinkedIn and Twitter feed they start wondering which company this is, and what they do exactly. Up until this point we have four touchpoints and counting. A week later they receive another email from the same company, only now they actually open it because they are curious… ’these guys are everywhere’ is the dominating thought in their mind. Touchpoints six and seven are articles that come up when the prospect “googles” the company name. In case you are wondering there is no magic in appearing in your leads’ social media feeds; it’s all a part of the advertising options each platform offers. All you need to find and target them is the email address of the lead (which you should already have if you included them in your email campaign) that will be matched with the email address they used to sign up.
This lead was nurtured to the point that it now becomes an inbound lead when they land on let’s say the listening247 website and request a free online consultation. From then on, a request for a proposal is solicited, one is sent, negotiated and closed. Job done!
A typical path to purchase or sales funnel starts with awareness, then interest, followed by consideration, intent, evaluation and purchase (see Fig. 2 below).

Google search, which is considered a source of qualified and mature leads, may indicate interest or consideration on behalf of the person searching. Both funnel stages come before purchase intent, and thus if there was a way to identify all the leads who intend to buy from a product category before intent is explicitly expressed, it brings us a big step closer to completing a purchase. The deeper we go in the sales funnel the more difficult it is to nurture and convert leads to the next stage; this is why if we can find a lead expressing purchase intent online it saves us tonnes of money and resources needed to nurture them from awareness to the next point in the funnel.
All you need is a social media listening tool that can accurately find people who express purchase intent online and has a machine learning capability to score the leads appropriately (see Fig. 1). Here is how it works:
As ever I am keen to engage in a conversation with you to compare notes, answer questions and ask some as well. Do contact me @L247_CEO or by email.

.webp)
Without a doubt it pays to be data driven. McKinsey Global Institute reports that data-driven organizations are now 23 times more likely to acquire customers, 6 times as likely to retain customers, and 19 times as likely to be profitable as a result.
Some organisations have business intelligence and market research departments, and many others don’t. Those who don’t are typically driven by the decisions of their senior management. What this means is that sometimes a handful of people work together to arrive to a consensus decision, and sometimes a single person - the CEO or the Head of a Department - makes a call based on their judgement alone. Unless their name is Steve Jobs or Jack Welch (well known autocratic leaders who got more things right than they got wrong), chances are their judgement or intuition or gut feeling (call it what you like) will not get them optimal results.
CEOs come and go, some have great intuition, some less so. Some are extrovert and some are “level 5 leaders” to use a definition from Jim Collins’ book ‘Good to Great’, the sequel to ‘Built to Last’… which by his own admission should have been the sequel.
HBS Professor Michael Tushman says so. Being data driven encourages a culture whereby gut feelings and anecdotal information do not carry a lot of weight.
There are many sources and types of data. There are structured and unstructured data (such as text, images and video clips). There are facts and there are opinions. We can get opinions by asking questions in surveys and focus groups, preferably through online communities* or by analysing unsolicited opinions using social media listening, social intelligence or social media monitoring, however you prefer to call this new discipline. And then we have our own data from accounting; sales, profit, expenses; you get the idea.
If all these data are available to all employees and everyone’s goals (including the CEO’s) are measured using these data, then we get public accountability through transparency. This point alone is enough reason for a company to decide to become data driven!
*Did you know you can create and fully customise your own online community? Start your cost and commitment free trial.
4. Fast & confident decisions:
When a business decision is based 80% on data and 20% on gut feeling then it will be fast and confident. Companies that take a long time to debate and decide on something, and then even longer to execute are overrun and crushed by their competitors.
When decisions are not based on mood and appetite but on data they tend to be consistent and inspire stability to all stakeholders.
Curiosity is a vital characteristic of innovative people. Data availability allows the curious to find answers to questions. The more the questions and answers the more the successes.
Abundance of data on its own will not do the trick. We need people to turn the data into information, then into knowledge and then into insight and hopefully foresight.
Talking about foresight, predictive analytics is what sometimes produces it. Without data predicting anything becomes a shot in the dark.
Becoming a data driven organisation is not possible from one day to the next. We need data, ways to analyse it and a data hungry culture with people that are data literate and buy into the concept. It takes commitment from the CEO and the management team and it takes perseverance. Unless there is objective data that supports a decision, regardless of how much we think we know what action to take, we should resist to take it and we should always ask the question: what data supports this decision?


